UC Berkeley Researcher Mines HathiTrust Volumes for Cliometric History of Postsecondary Education in California
By guest blogger, UC Berkeley Economist Zach Bleemer
Editor’s note: UC Libraries continue to digitize and add to the HathiTrust corpus that is now over 14.7 million volumes. A key reason for digitizing library collections is to facilitate new forms of computer-aided research such as text and data mining that can advance knowledge in novel ways. This is one such story.
The University of California (UC) has contributed more than 3.8 million digitized volumes to the HathiTrust Digital Library since the latter was founded in 2008. Those volumes include hundreds of published registers and directories documenting 20th century California society, including detailed information about hundreds of thousands of university students and professors, doctors, and teachers between 1893 and the present. Combined with contemporary computing power and advanced statistical machinery, these records have the potential to shed light on the long-run contribution of California’s public and private universities to the state’s impressive record of growth, economic mobility, and gender equality.

Figure 1: From the Register of the University of California, 1910-1911
As a social scientist, stumbling upon such a trove of information is both stimulating and daunting. The first challenge in conducting our Cliometric History of American Postsecondary Education (CHAPE)—the large-scale study which my colleagues and I initiated in the beginning of this year—was obtaining legal permission to view a number of volumes published after 1922, many of which were not in the public domain. In April of this year, a team of librarians from UC Berkeley and the California Digital Library secured the release of more than 150 volumes published by the University of California; in June, librarians at Mills College accomplished a similar release. We are in the process of obtaining a similar rights release for hundreds more volumes from several other universities and organizations.
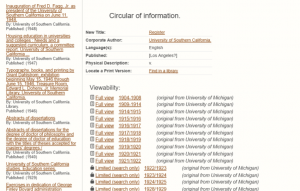
Figure 2: Post-1922 records from the University of Southern California remain outside the public domain
Despite substantial improvements over the past two decades, optical character recognition (OCR) software remains unable to produce high-quality renderings of thousands of pages of heavily-formatted directories into computer-readable text. Using a technique analogous to massive parallel DNA sequencing, we acquire multiple digital copies of each volume, produce multiple OCR text files from each digital copy (using OCR software from Google, ABBYY, Adobe, and Nuance), and then algorithmically combine the information from each text file into a single high-quality conglomerate. The result is a massive database with more than 2.5 million observations, including, for example, annual entries for every undergraduate or medical student who attended the University of California (at its Berkeley, San Francisco, Los Angeles, or Davis campuses), Stanford University, the California Institute of Technology, and Mills College between 1893 and 1946, including their name, year of study, hometown, and field of study.
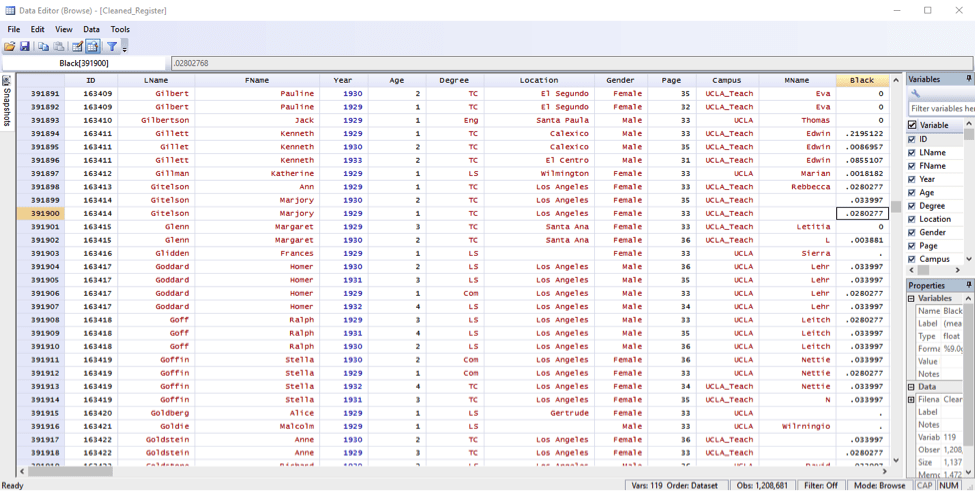
Figure 3: UCLA students at the beginning of the Great Depression. From the CHAPE Database.
We augment our database in a number of ways. We determine individuals’ genders by comparing their first names with contemporaneous Social Security birth statistics, and geo-locate towns using the GeoHack database. We also generate unique individual ID numbers across highly-similar names in order to link individuals over time: for example, connecting an individual’s year of university matriculation with her year of graduation. After verifying the quality of these inferences, we can produce maps like those shown below, which display towns that matriculated at least five students at California universities in 1900 and 1930. The size of each circle is log-proportional to the number of students from that town, while the color reflects the proportion of those students who are male or female (black means all-female, white all-male).
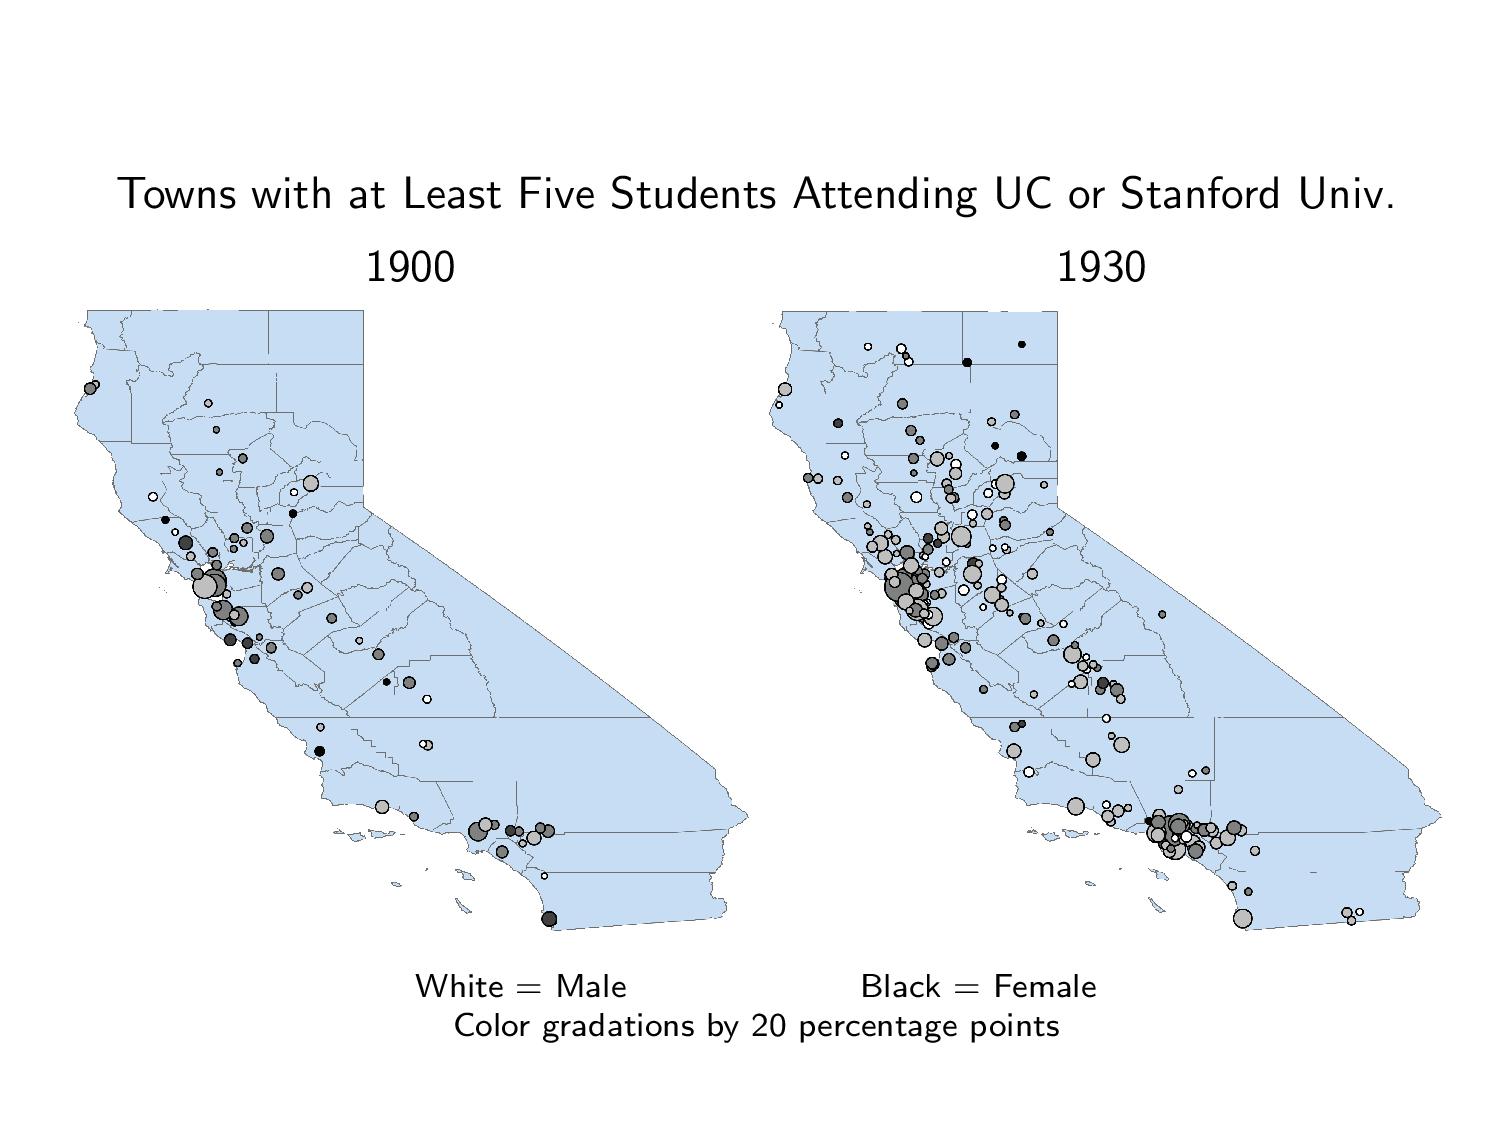 Figure 4: Towns that sent at least five students to CA universities in each year, and the proportion male (white-male, black=female). Data from the CHAPE database. Click image for larger view.
These maps concisely display California’s population growth, the growth of its universities, the approximate gender-equality in its university participation, and the geographic expansiveness of university attendance (nearly 20 percent of students were from rural areas) in the early 20th century. The next map shows one aspect of the important role played by the University of California in expanding the state’s educational system: UC was by far the largest supplier of high school teachers in the state, and was especially important in rural areas.
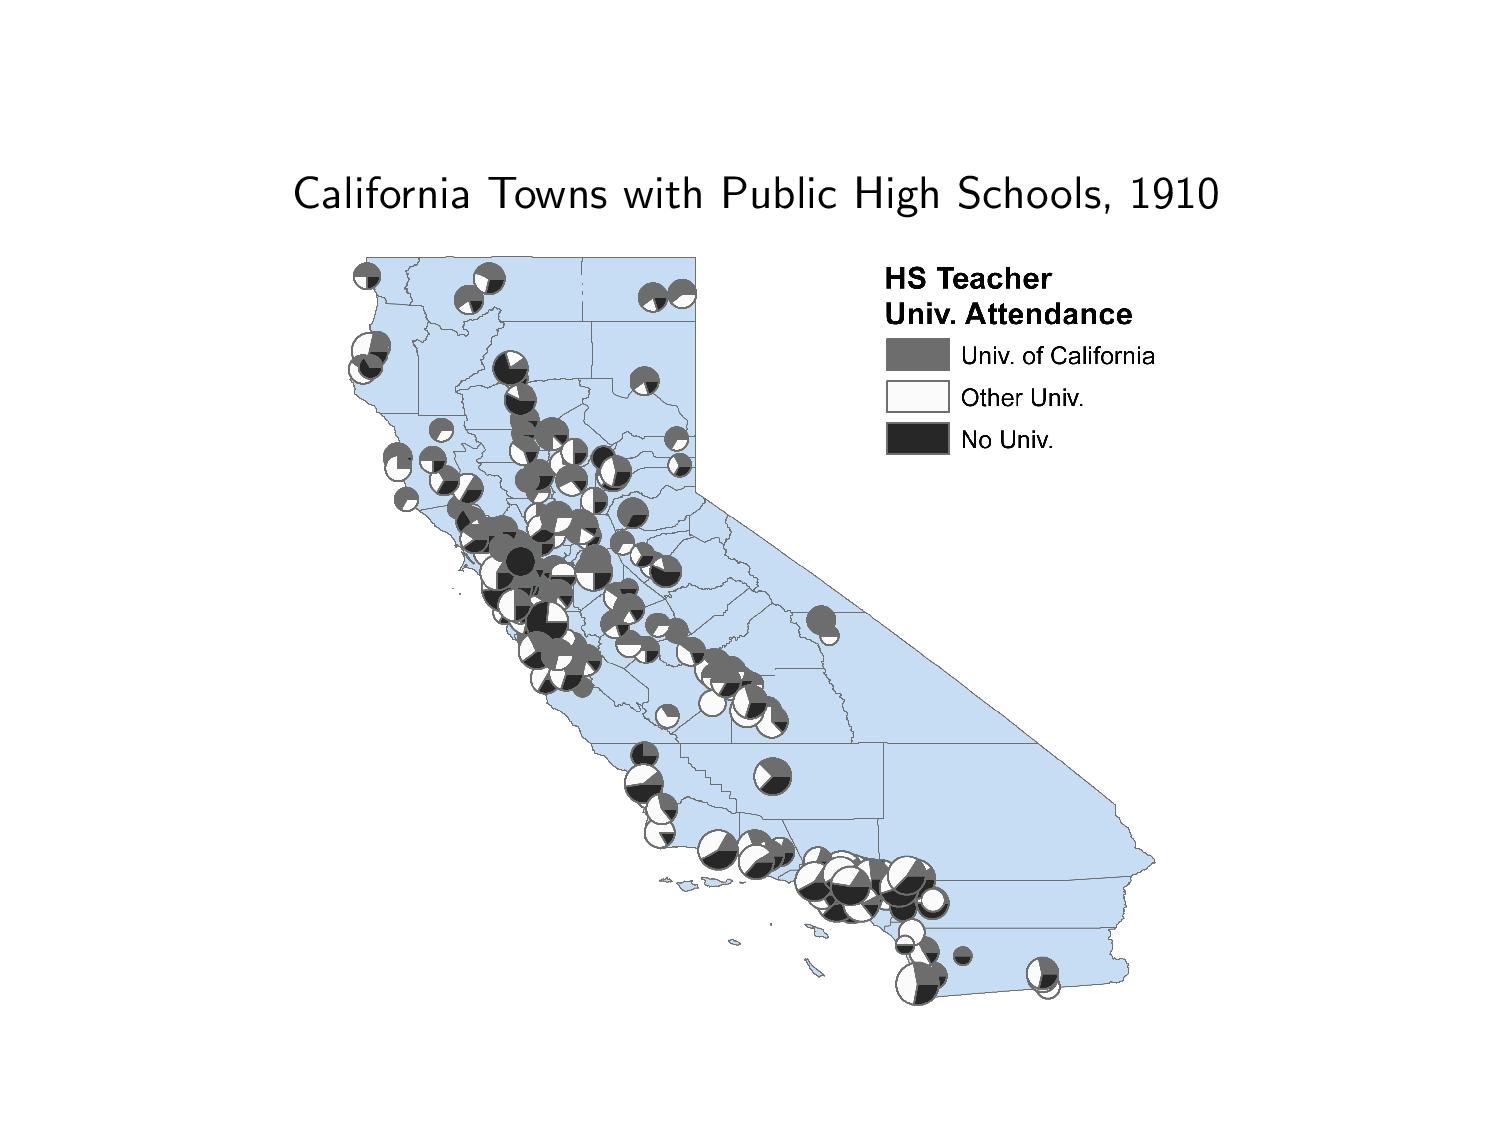
Figure 5: California High Schools in 1910. The size of each circle is proportional to the number of teachers at that school, and the pie chart shows the proportion of teachers who attended UC. Data from the CHAPE database. Click image for larger view.
Our data also allow us to examine the gender gap among teachers and doctors in the first half of the twentieth century, the growth and decline of academic departments (in number of professors as well as number and variety of courses) between 1900 and the present, and the slow expansion of women and members of various ethnic groups into professions across California. In addition, statistical analysis of our data has provided strong evidence of a role model effect in female college attendance after the arrival of the first female doctor or high school chemistry/physics teacher in rural communities, explaining part of the substantial rise of female college-going throughout this period.
This project remains in its early stages, and I will be continuing to collaborate with the California Digital Library, the Center for the Study of Higher Education, the Berkeley Economic History Laboratory (http://behl.berkeley.edu/), and other organizations to enhance and broaden our findings through new digitization, copyright-release, and computational processing. We are currently working to identify sources of contemporary information to expand our study to the present, which would magnify its relevance to California residents and policy-makers, and intend to develop an interactive website to increase the accessibility of our historical data to the public. The Cliometric History of American Postsecondary Education project is intended to provide fruitful social-scientific research on the contribution of California’s universities to the state’s 20th and 21st century growth and economic mobility, and we will continue our research with that goal in mind.
Please direct questions and comments to bleemer@berkeley.edu.